Crop reflectance sensors quantify the optical response of a canopy. Their measurements can describe differences in vegetation cover and pigment absorption across a field, supporting nitrogen-response assessment, treatment comparisons and variable-rate application. Interpretation depends on crop development, canopy structure and the sensing geometry.
Reflectance and vegetation indices
Reflectance is the fraction of incident radiation returned from a surface within a specified wavelength band. Chlorophyll absorbs strongly in the red part of the visible spectrum, while leaf structure produces a different response in the near infrared. Canopy instruments measure combinations of these bands, usually expressed as ratios or normalised indices rather than a direct concentration of nitrogen.
The normalised difference vegetation index is NDVI = (NIR − red) / (NIR + red). The quantities must share a consistent reflectance scale. With NIR reflectance of 0.50 and red reflectance of 0.10, NDVI is 0.667. This dimensionless result describes an optical contrast; converting it into biomass or a fertiliser rate requires a crop-specific relationship. The normalised difference red-edge index substitutes a red-edge band for the red band. Its response can remain useful where dense vegetation makes red-band NDVI less sensitive to further increases in canopy development.
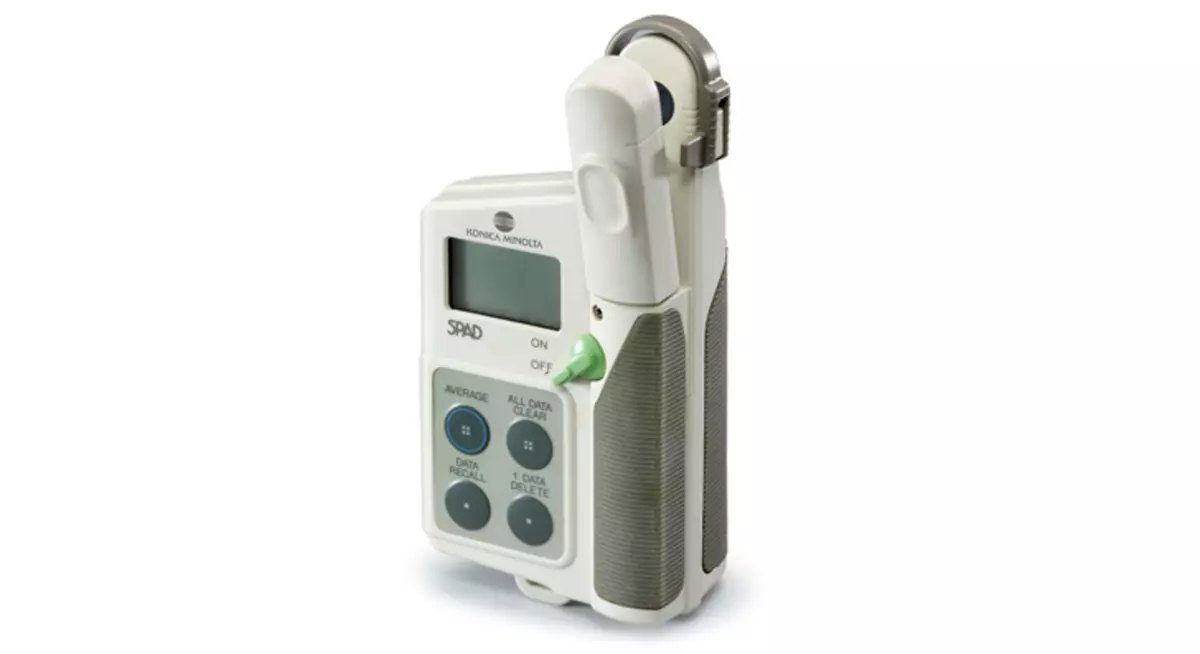
A handheld leaf clip and a canopy sensor also sample different structures. The former isolates a leaf area, whereas the latter integrates leaves, shadows, exposed soil and residue within its footprint. An increase in canopy NDVI may reflect greater ground cover as well as a change in leaf pigment concentration.
Handheld and machine-mounted systems
Active instruments supply their own illumination and separate the returned signal from ambient light. Passive instruments use sunlight and need suitable incident-light measurement or a documented reference procedure. The distinction affects operating conditions, but active illumination does not remove errors caused by dust, water films, mounting angle or a canopy outside the working distance.
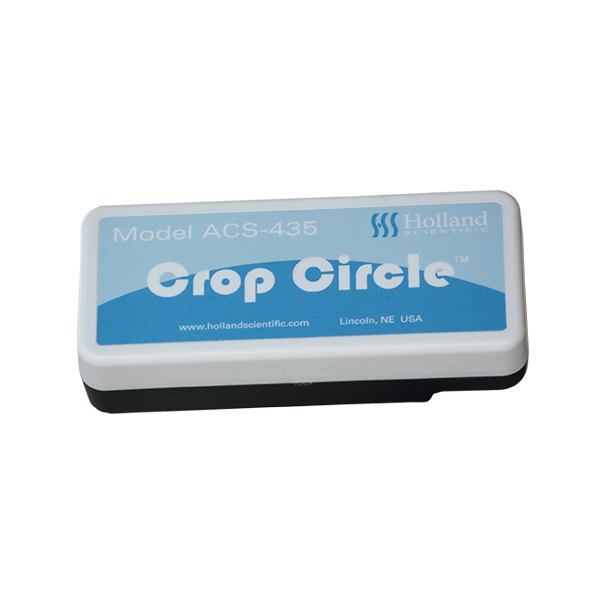
ACS-435 canopy reflectance sensor
Holland Scientific Crop Circle ACS-435
An active canopy instrument for reflectance observations and vegetation-index work. Its own illumination supports measurements under changing ambient light.
Commission height, logging and application-controller integration.
View product details ↗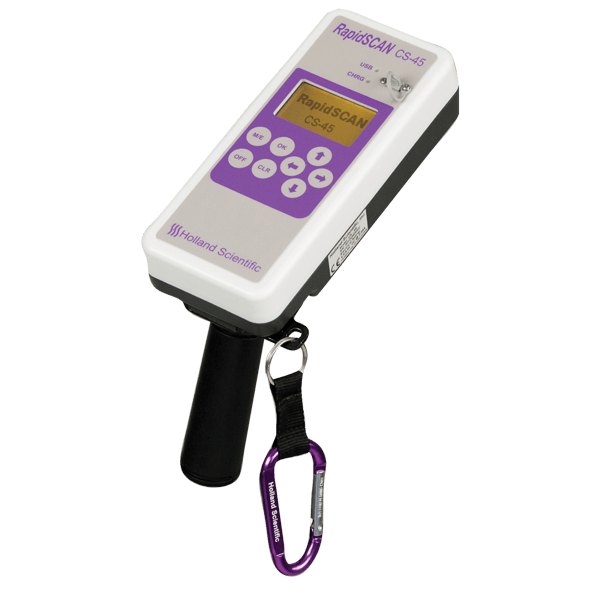
RapidSCAN CS-45
Holland Scientific RapidSCAN CS-45
A self-contained active canopy scanner with a display, onboard logging and GPS. It records reflectance and both red and red-edge vegetation indices.
Manufacturer page has conflicting battery-duration statements; no runtime comparison is made.
View product details ↗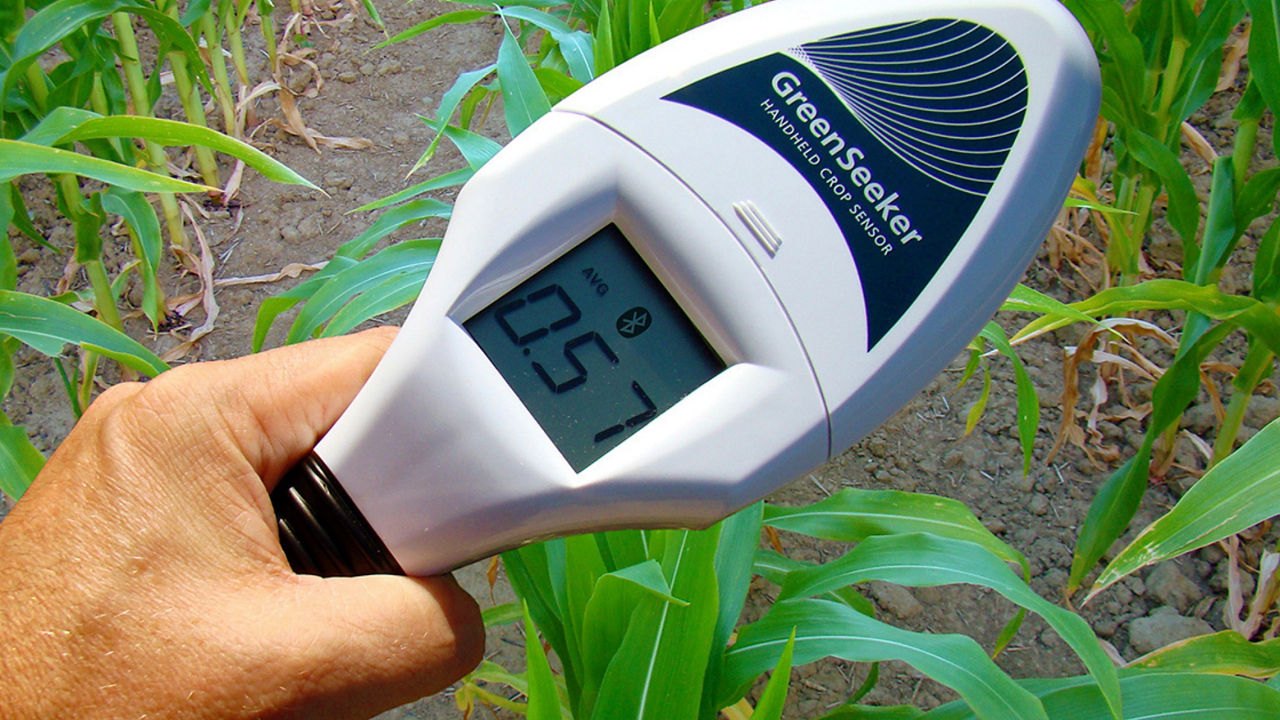
Bluetooth handheld version
PTx Trimble GreenSeeker handheld
A handheld active instrument for local NDVI observations. The documented Bluetooth version can record data through a compatible mobile application.
Verify the supplied generation and app compatibility; NDVI is an optical proxy.
View product details ↗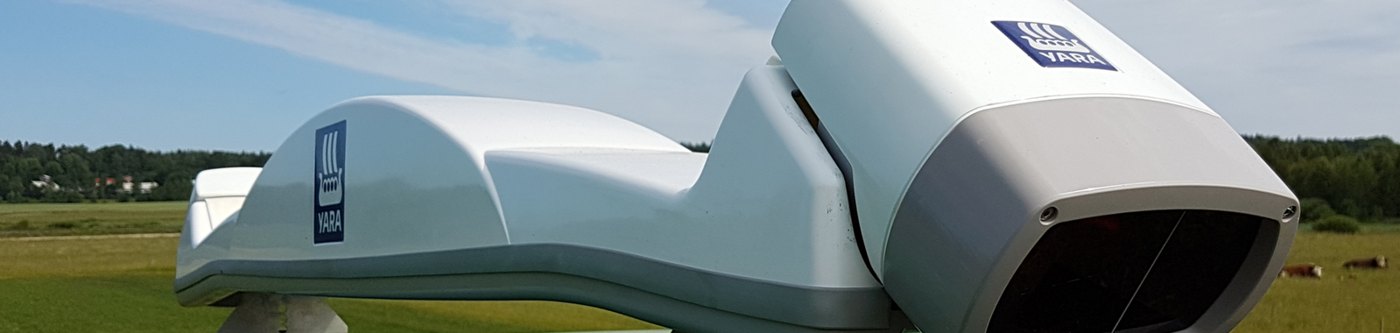
N-Sensor ALS 2; regional crop calibrations
Yara N-Sensor ALS 2
An active-light-source tractor system connecting canopy observations with crop-specific nitrogen application models. Its integration is oriented towards variable-rate spreading or spraying.
Crop calibration, controller compatibility and dew conditions affect the complete installation.
View product details ↗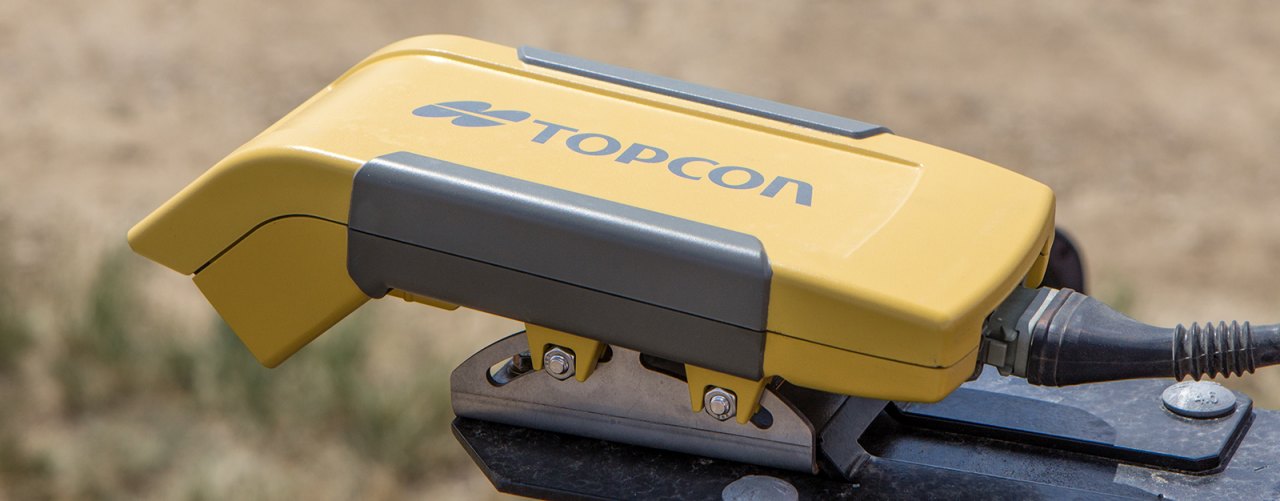
CropSpec with compatible X-family consoles
Topcon CropSpec
Cab-mounted crop sensors that support recording field variation and compatible variable-rate application. The current manufacturer page identifies X-family console integration.
Check sensor configuration, console generation and implement support.
View product details ↗| Model | Measurement / role | Data connection | Coverage / installation |
|---|---|---|---|
| Holland Scientific Crop Circle ACS-435 | Active canopy reflectance and vegetation indices | Sensor connected to compatible logging/application equipment | Machine-mounted canopy footprint |
| Holland Scientific RapidSCAN CS-45 | 670, 730 and 780 nm reflectance; NDVI and NDRE | Integrated logger and GPS; USB data transfer | Handheld canopy scanning; stated typical distance 0.3 m to over 3 m |
| PTx Trimble GreenSeeker handheld | NDVI using red 660 nm and NIR 780 nm | Bluetooth on documented handheld variant; compatible app | Handheld operation 60–120 cm above canopy |
| Yara N-Sensor ALS 2 | Canopy reflectance interpreted through crop-specific nitrogen models | Compatible variable-rate spreader/sprayer installation | Tractor-mounted canopy monitoring |
| Topcon CropSpec | Canopy reflectance and crop-monitoring interpretation | Compatible Topcon X-family console and application control | Cab-mounted sensors with oblique view |
Sampling geometry and field variation
The measurement footprint changes with the optics and working distance. A sensor mounted above a sprayer boom samples a narrow route through the field, while a cab-mounted instrument can look obliquely across a wider canopy. The resulting observations represent the viewed vegetation, not automatically the full application width. Overlapping passes, missing crop rows and tractor wheelings should retain their spatial context when readings are converted into a map.
Record sensor height relative to the crop, not just relative to the ground. Lodging and changes in crop height can alter the viewed fraction of soil. Repeated surveys need comparable growth stages, row orientation and sampling positions. For handheld work, several readings distributed across a management zone are more informative than a single reading from the most vigorous plant.
Georeferencing introduces another error budget. Position accuracy, clock synchronisation, antenna-to-sensor offset and machine speed all affect the location of an observation. At 10 km/h a machine moves about 2.78 m in one second. A one-second timestamp offset therefore shifts the mapped measurement by roughly that distance before accounting for the physical offset of the sensor.
Nitrogen response and application control
An adequately fertilised reference strip provides a local comparison for the crop's nitrogen response. Its value is that it experiences broadly similar weather, soil and crop development to the surrounding field. It does not establish that every low-index area will respond to more nitrogen: waterlogging, drought, disease, compaction and poor establishment can also reduce canopy development.
The Oklahoma State University nitrogen-rich-strip approach links crop sensing to local reference observations and calibrated agronomic interpretation. A response ratio is an intermediate analytical quantity, not a universal prescription. Application software also requires crop stage, the chosen rate model and operational limits. The final command has to be compatible with the spreader or sprayer controller and its achievable response time.
Development of ground-based crop sensing
Vegetation indices originated in remote sensing before compact active instruments brought repeatable illumination into field and machine applications. Yara introduced its first N-Sensor in 1999, followed by active-light-source versions. Trimble introduced the GreenSeeker handheld in 2012. These developments expanded access to crop observations, while agronomic calibration remained specific to the crop and production setting.
Terminology
- Red edge
- The rapid change in vegetation reflectance between the red and near-infrared regions; an instrument measures a finite band within this region.
- Active illumination
- Radiation supplied by the sensor rather than relying solely on sunlight.
- Reference strip
- A defined field area managed to support comparison with the surrounding crop.
- NDRE
- A normalised ratio of near-infrared and red-edge reflectance.
Questions about canopy measurements
Can reflectance establish the cause of a weak crop area?
It identifies a spectral difference. Field examination, soil information and plant analysis help distinguish nutrient response from other causes. The map is useful for directing that investigation.
Can readings from different sensor brands be combined?
Band centres, bandwidths, illumination and viewing geometry differ. Keep the instrument identity with the data and establish a cross-instrument relationship before merging time series or applying a shared threshold.
Sources & further reading
- Holland Scientific Crop Circle ACS-435 manufacturer documentation
- Holland Scientific RapidSCAN CS-45 manufacturer documentation
- PTx Trimble GreenSeeker handheld manufacturer documentation
- Yara N-Sensor ALS 2 manufacturer documentation
- Topcon CropSpec manufacturer documentation
- Nitrogen-rich strips for wheat, corn and other crops
- Optical sensors and plant nitrogen status