Plant nutrient assessment combines optical measurements, sap chemistry and laboratory analysis. Chlorophyll meters provide rapid leaf observations; ion-selective meters analyse a prepared liquid sample. The distinction between a measured signal and its agronomic interpretation determines which tool is suitable for a nutrient-management programme.
Optical measurements and nitrogen proxies
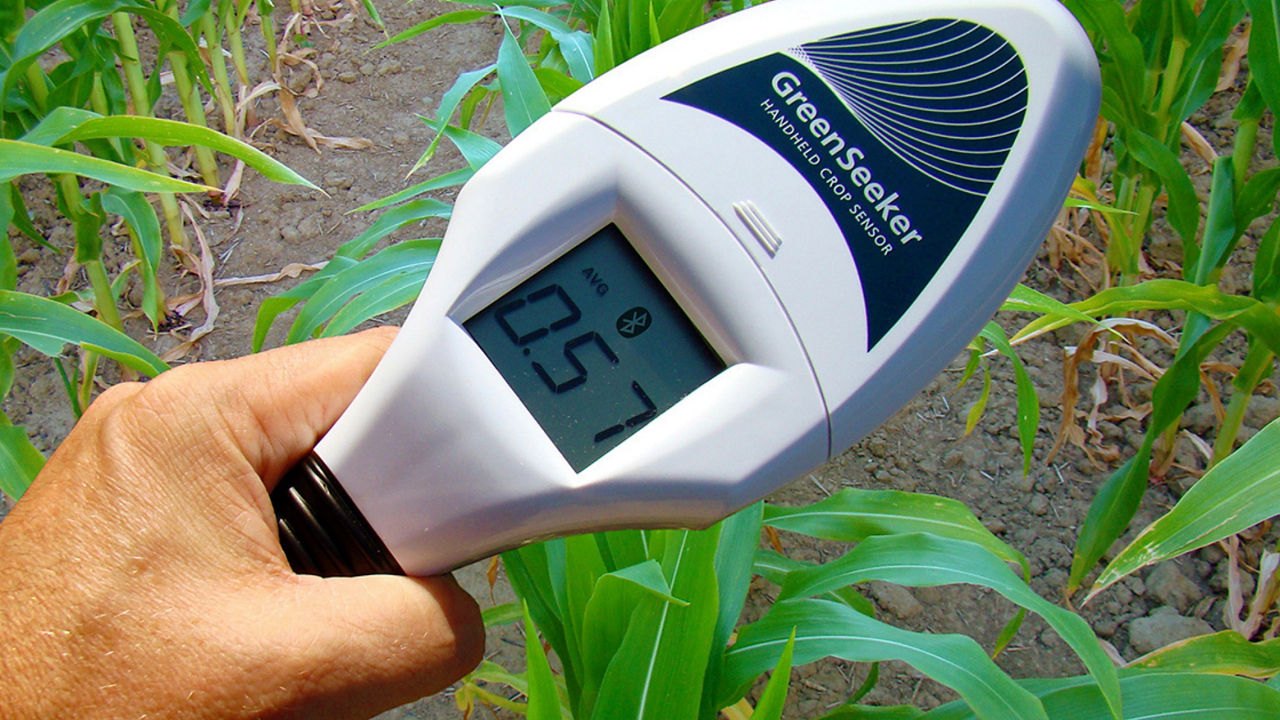
Leaf chlorophyll meters compare light transmission at wavelengths with different pigment absorption. A relative meter reports an instrument-specific index. Instruments with a calibrated relationship can report an estimate of chlorophyll per unit leaf area, often in µmol/m² or µg/cm². Neither output is a direct measurement of nitrogen, phosphorus or potassium in the leaf.
Nitrogen status can correlate with chlorophyll under suitable crop and growth-stage conditions. Other influences include leaf thickness, cultivar, water status, ageing and deficiencies affecting pigment formation. A chlorophyll reading is therefore most informative within a consistent sampling programme and a validated relationship, rather than as a universal nutrient sufficiency score.
Fluorescence-based leaf instruments can add information about epidermal compounds. Ratios combining chlorophyll and flavonol signals can support nitrogen-status assessment, but their relationship with actual tissue concentration still depends on calibration and crop conditions. The measurement window must be covered by the intended leaf area; veins and partially covered apertures change the optical sample.
Leaf meters and sap-analysis tools
The optical instruments below preserve the leaf for repeated observation. The nitrate meter instead measures a prepared sap or solution sample with an ion-selective electrode. It answers a different analytical question and is included as a complementary route for nutrient diagnosis.
SPAD-502Plus
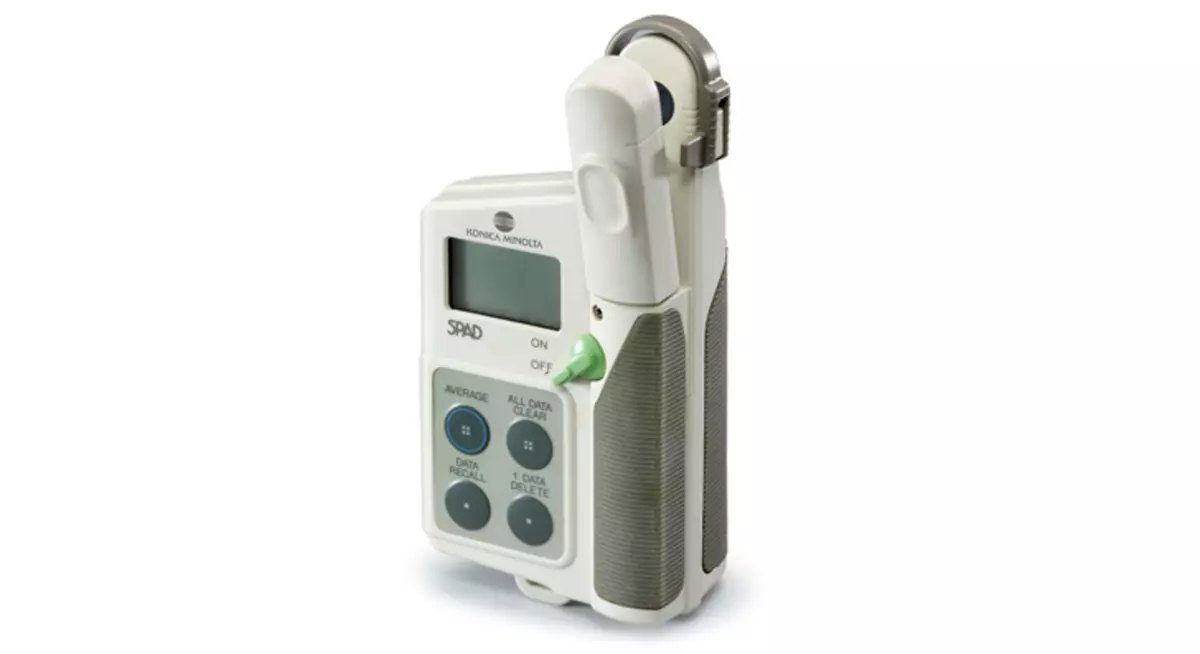
Konica Minolta SPAD-502Plus
A portable leaf clip that compares optical absorption and reports a relative SPAD index. It supports repeated non-destructive pigment observations across a crop.
SPAD is a relative index; leaf class and local crop calibration affect nitrogen interpretation.
View product details ↗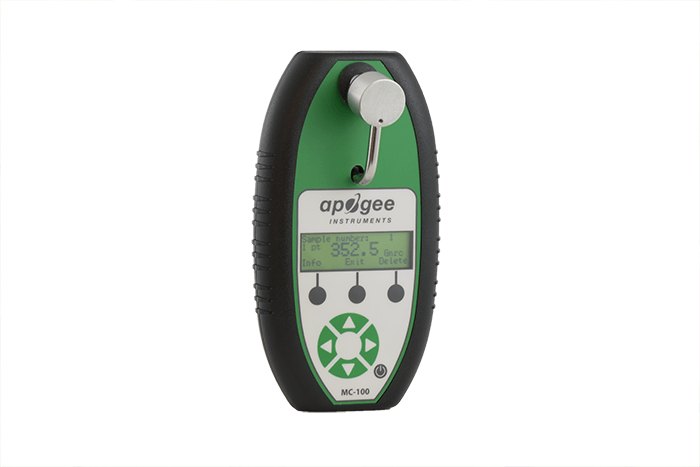
MC-100; species equation selected in instrument
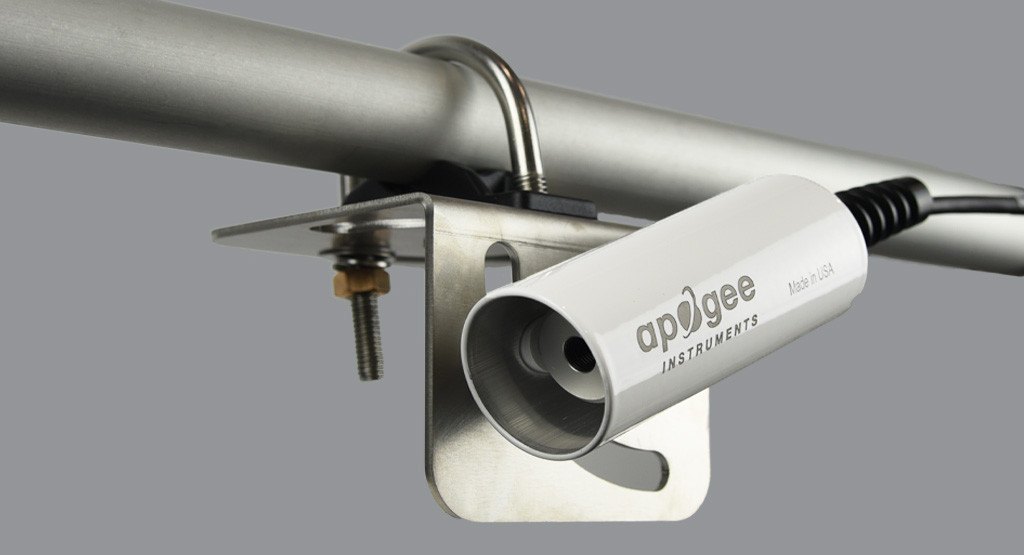
Apogee MC-100
A transmittance-based meter with crop-specific equations for chlorophyll concentration. A smaller aperture accommodates narrow leaves, while stored observations support repeat surveys.
Species equations determine concentration estimates; the instrument does not measure elemental nitrogen.
View product details ↗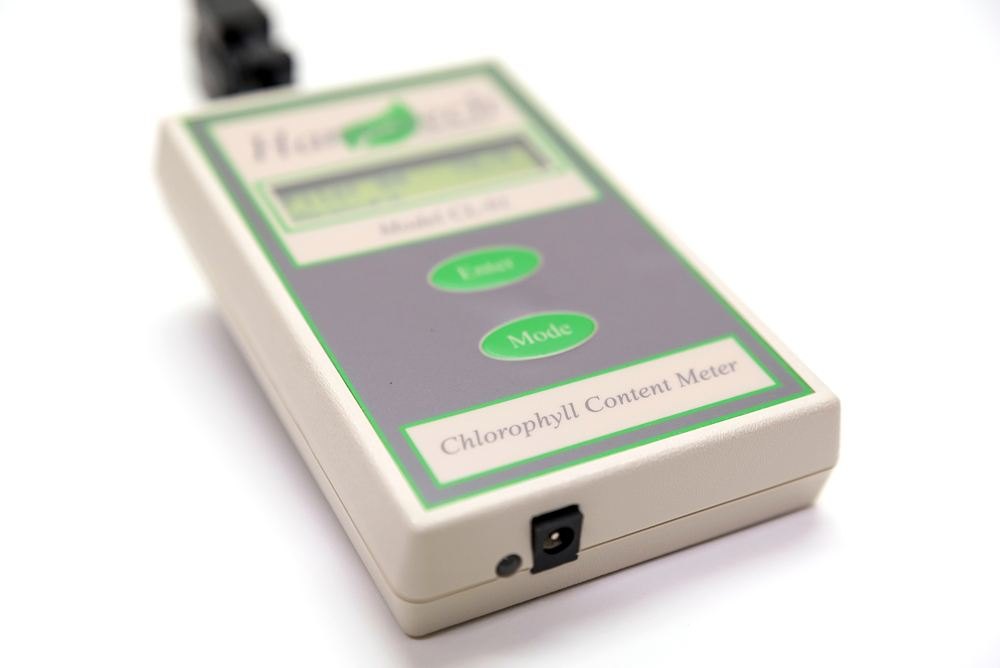
CL-01
Hansatech CL-01
A dual-wavelength leaf meter reporting relative chlorophyll. It stores readings for review and averaging without requiring a connected computer.
Its relative scale should retain instrument identity and consistent sample selection.
View product details ↗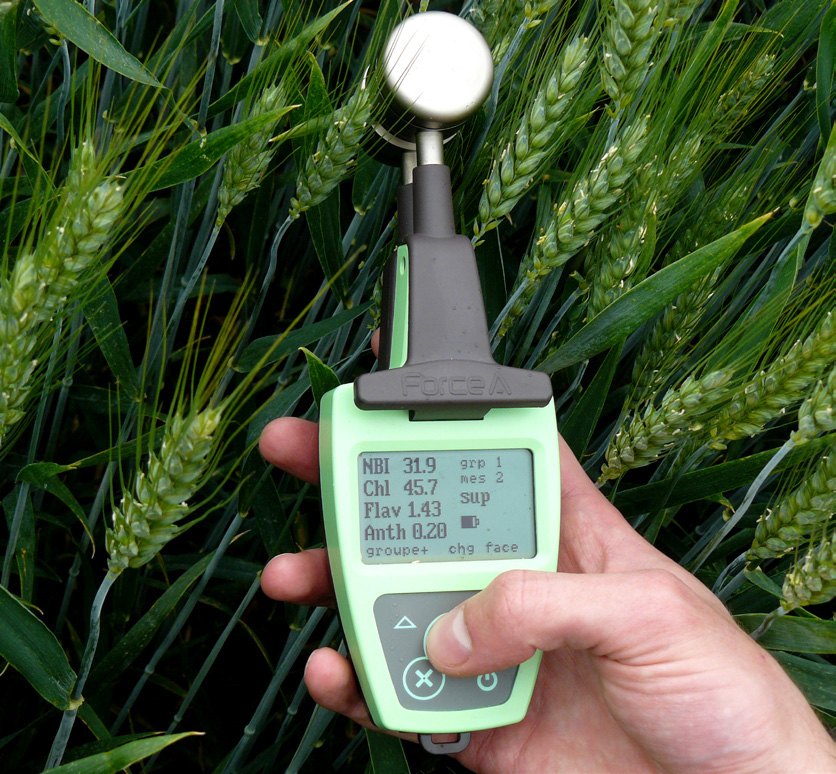
Dualex optical pigment meter
FORCE-A Dualex
A leaf-clip instrument combining pigment transmittance and fluorescence-screening measurements. Its nitrogen-balance index relates chlorophyll and flavonol signals rather than directly assaying nitrogen.
Brochure generation needs confirmation in current supply; NBI is an interpreted optical ratio.
View product details ↗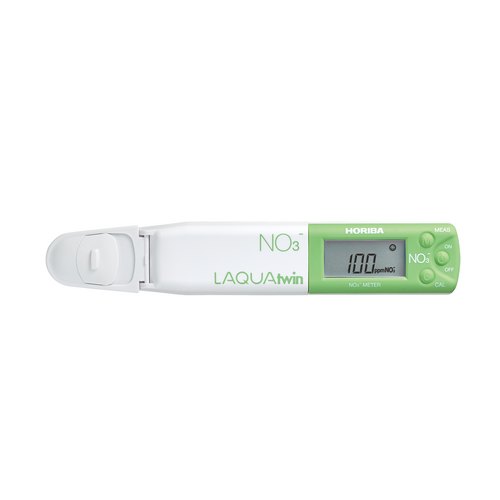
NO3-11C crop package; NO3-11 and NO3-11S differ in supplied standards
HORIBA LAQUAtwin NO3-11C
A crop-oriented nitrate meter using a replaceable ion-selective electrode. It analyses a collected liquid sample and is complementary to non-destructive optical leaf meters.
Calibration, dilution, sample matrix and nitrate-versus-nitrate-N units affect interpretation.
View product details ↗| Model | Measurement / role | Data connection | Coverage / installation |
|---|---|---|---|
| Konica Minolta SPAD-502Plus | Relative chlorophyll index in SPAD units | Handheld display and onboard reading memory | Leaf clip; 2 × 3 mm sample area |
| Apogee MC-100 | Estimated chlorophyll concentration in µmol/m²; relative outputs available | Onboard storage and USB data transfer | Leaf clip; 9 mm aperture or 5 mm reducer |
| Hansatech CL-01 | Relative chlorophyll from 660 and 940 nm absorbance | Handheld display; memory for 60 readings | Leaf-level optical measurement |
| FORCE-A Dualex | Chlorophyll, flavonol, anthocyanin and NBI optical outputs | Onboard GPS and CSV/USB transfer in documented brochure | Leaf clip; stated 19.6 mm² area |
| HORIBA LAQUAtwin NO3-11C | Nitrate or nitrate-N concentration in prepared liquid sample | Handheld ion-selective-electrode meter | 0.3 mL standard minimum sample volume |
Indices, concentration and sample basis
SPAD and other relative optical units are instrument scales. A value of 40 on one meter does not necessarily correspond to 40 on another. Converting to chlorophyll concentration requires a documented equation for the relevant instrument and sample type. Apogee's MC-100 uses species-dependent equations; the generic relationship should retain its stated scope when a specific crop setting is unavailable.
Sap nitrate concentration can be reported as nitrate, NO₃⁻, or nitrate-nitrogen, NO₃-N. These are different mass bases. The conversion uses the nitrogen fraction of nitrate: 14/62, approximately 0.226. A sample containing 1,000 mg/L nitrate contains about 226 mg/L nitrate-nitrogen. Applying a threshold for nitrate-N to a nitrate display would therefore introduce a substantial interpretation error.
Laboratory tissue analysis commonly reports a nutrient concentration on a dry-matter basis. It should not be compared directly with mg/L in sap. Tissue selection, drying, preparation and the laboratory method define the result. A paired dataset can establish a relationship for a crop, but does not make the two sample bases identical.
Leaf selection and chemical sampling
Optical surveys need consistent leaf age, position and measurement location. Mature and expanding leaves can have different pigment concentration and thickness. Record the sampled organ, crop stage and whether the reading is from the same marked leaf or a newly selected sample. Replicate measurements across the management zone rather than combining incompatible leaf classes into a single average.
For sap testing, the sampling protocol specifies which petioles or tissue portions to collect, how to extract the sap and the time between collection and measurement. Dilution with deionised water requires its factor to be applied to the measured concentration. Standards should bracket the working range, and the electrode should be cleaned and stored according to its instructions.
The ion-selective electrode responds to the activity of the target ion within a sample matrix. Other ions and changing sample conditions can influence the result. Calibration, temperature control and sample preparation are consequently part of the analytical method. A meter that accepts a small liquid volume does not remove the need for a representative field sample.
Interpreting nutrient status
Optical differences can direct tissue sampling towards a suspected problem or quantify treatment response. Laboratory analysis can then establish several nutrient concentrations from the specified organ and stage. Soil conditions, root health and weather help explain why nutrient uptake differs even where fertiliser supply appears adequate.
University guidance on tissue sampling emphasises that sufficiency ranges belong to a defined crop, organ and growth stage. A value outside such a range is interpreted in that context. A nutrient programme should also retain the distinction between diagnosing a current plant condition and predicting the crop's response to an additional fertiliser application.
Development of leaf optical analysis
Portable leaf meters made repeatable, non-destructive pigment observations available in the field, complementing laboratory extraction. The SPAD product family established a widely used relative index, while later instruments added calibrated concentration equations, georeferencing and additional pigment signals. Parry, Blonquist and Bugbee's 2014 study examined relationships between optical indices and extracted chlorophyll across multiple plant species, illustrating why a species-specific calibration can matter.
Terminology
- Chlorophyll index
- An optical quantity related to pigment absorption, expressed on a specified instrument scale.
- Nitrogen proxy
- A signal correlated with nitrogen status under defined conditions, rather than direct elemental analysis.
- Ion-selective electrode
- An electrode responding preferentially to a particular dissolved ion.
- Dry-matter basis
- Concentration expressed relative to the mass of dried tissue rather than fresh sap volume.
Questions about nutrient measurements
Can a chlorophyll meter identify a potassium deficiency?
A change in pigment can accompany several stresses, but does not identify potassium concentration. Suitable tissue analysis and crop examination address that question.
Should sap nitrate replace laboratory tissue analysis?
Sap nitrate offers a rapid, targeted observation. Laboratory analysis can cover a broader nutrient suite and provides results on a different sample basis. Their roles depend on the crop's validated diagnostic programme.
Sources & further reading
- Konica Minolta SPAD-502Plus manufacturer documentation
- Apogee MC-100 manufacturer documentation
- Hansatech CL-01 manufacturer documentation
- FORCE-A Dualex manufacturer documentation
- HORIBA LAQUAtwin NO3-11C manufacturer documentation
- MC-100 manual and species calibration
- Plant sap testing for nitrogen and potassium
- Tissue sampling and crop-stage interpretation