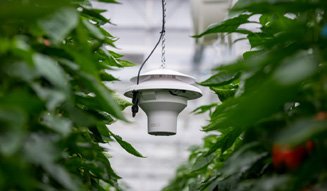
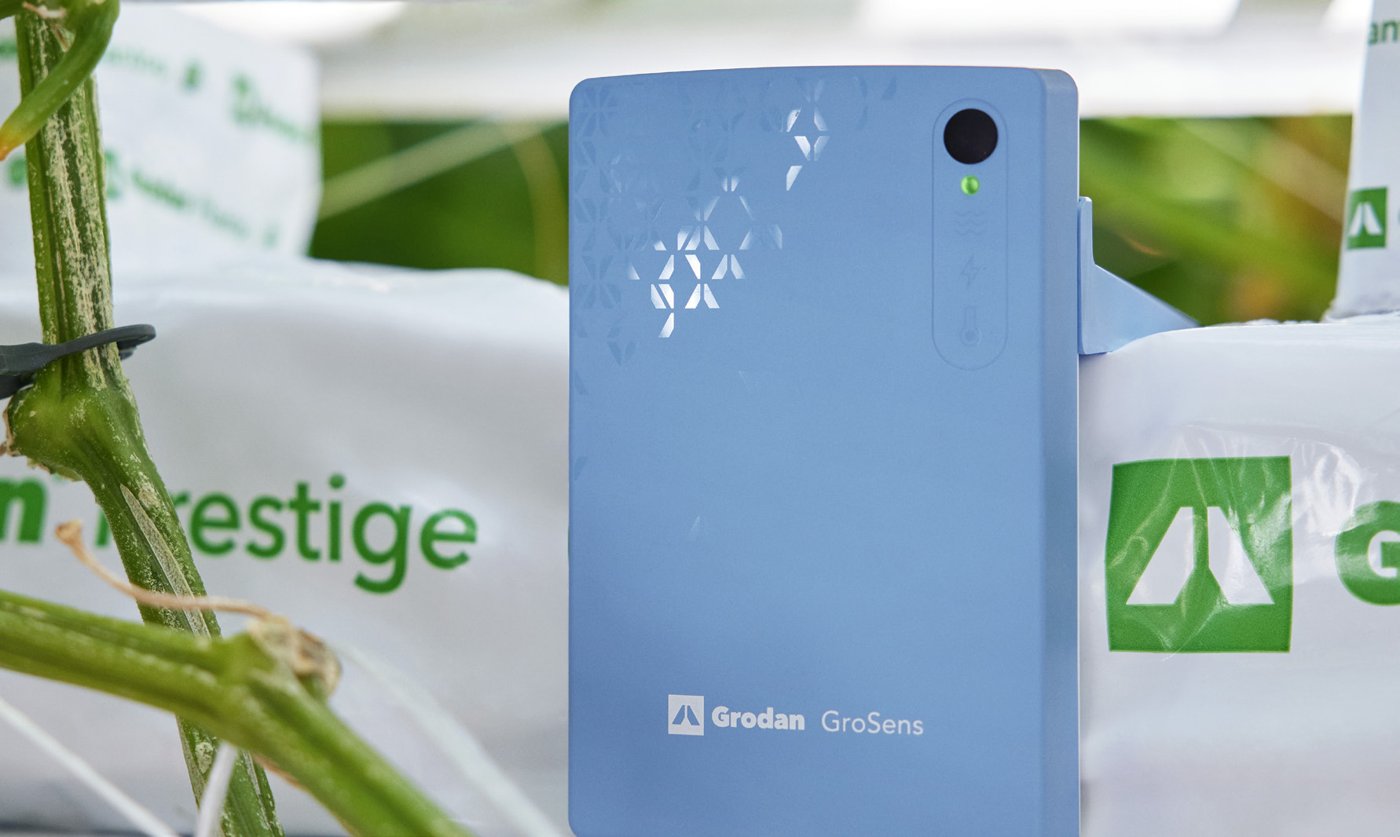
Carbon dioxide and light describe two different inputs to photosynthesis. CO2 instruments measure the gas around the crop; quantum sensors measure the photons reaching a surface. Choose a pair that can be installed, maintained and recorded together rather than treating one reading as evidence that the other is adequate.
Separate gas concentration from light delivery
CO2 is usually reported in parts per million by volume. Light used in conventional horticultural PAR measurements covers approximately 400–700 nanometres. Photosynthetic photon flux density, or PPFD, expresses the rate of arriving photons in micromoles per square metre per second. A lux reading is weighted for human vision and cannot be substituted directly for PPFD across different lamp spectra.
A light record tells you what reached the sensor's location. A CO2 record tells you what was sampled at another location. Neither describes the complete crop response. Leaf temperature, water supply, canopy shading and ventilation help explain why the same settings produce different conditions.
CO2 probes and light instruments
The first two instruments address CO2 observations. The remaining three measure light. Select across those groups to assemble a measurement package; a PAR sensor cannot replace a gas instrument. Readout hardware, power, network equipment and mounting fixtures belong in the comparison.
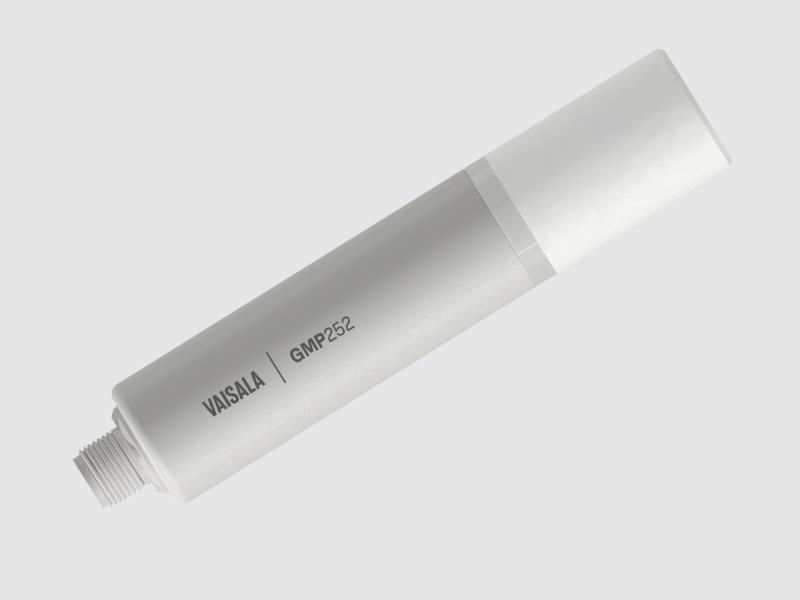
GMP252 CARBOCAP carbon dioxide probe
Vaisala GMP252
A carbon dioxide probe intended for humid industrial and greenhouse environments. Its heated sensing head and compensation functions support demanding installations.
It needs suitable power and a host; temperature compensation is not a complete climate measurement system.
View product details ↗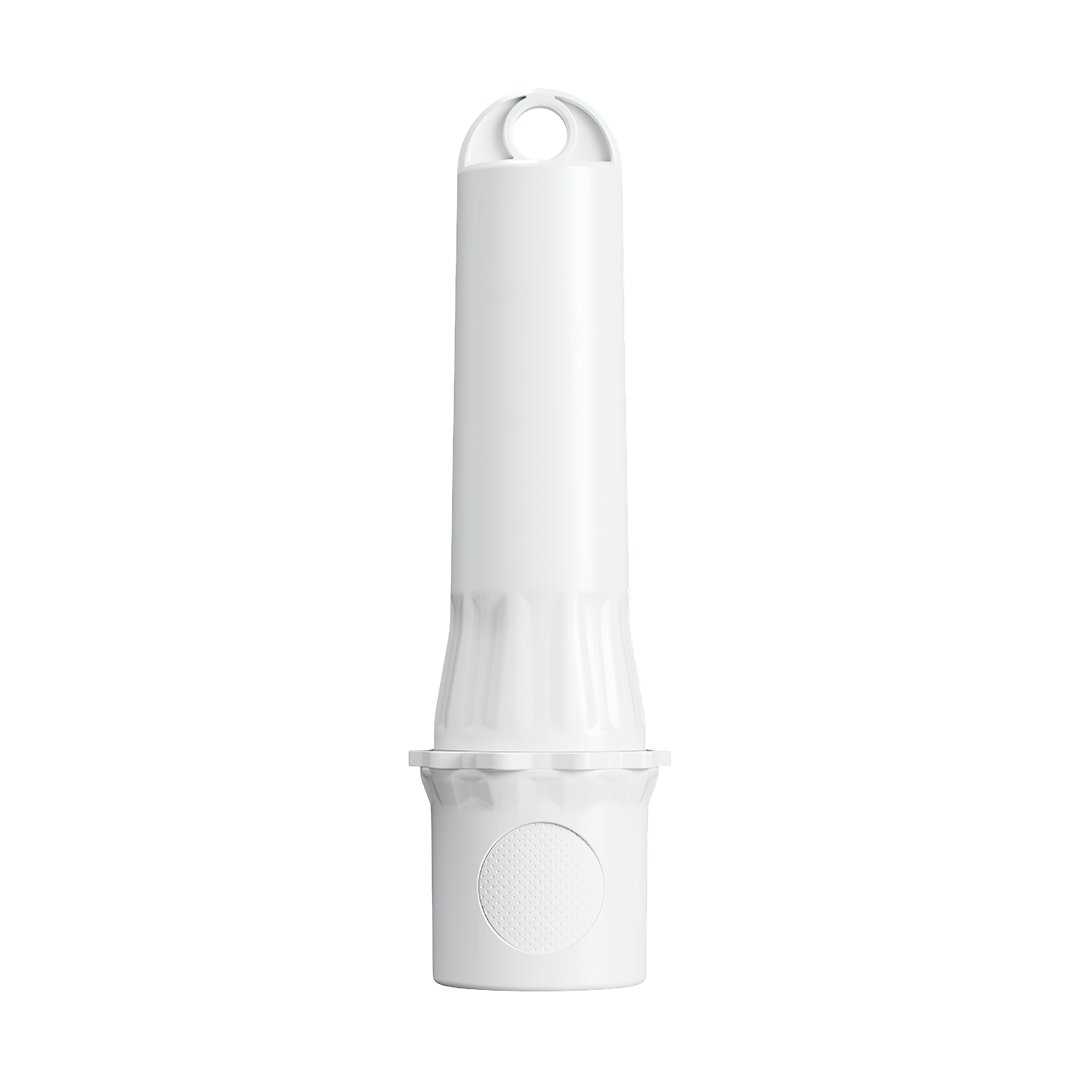
Aranet PRO-series CO2, temperature and pressure sensor
Aranet CO2 and Temperature Sensor
A battery-powered CO2, temperature and pressure instrument that sends measurements to the Aranet PRO network.
Select the regional radio version and a calibration approach appropriate to enriched air.
View product details ↗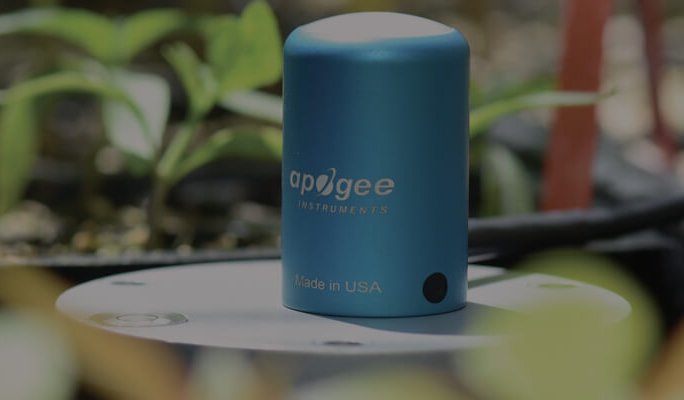
SQ-500-SS unamplified full-spectrum quantum sensor
Apogee SQ-500-SS
A quantum sensor for greenhouse, growth-chamber and outdoor PPFD observations, with an unamplified analog signal.
Other SQ-series models use different outputs; retain this sensor’s calibration factor.
View product details ↗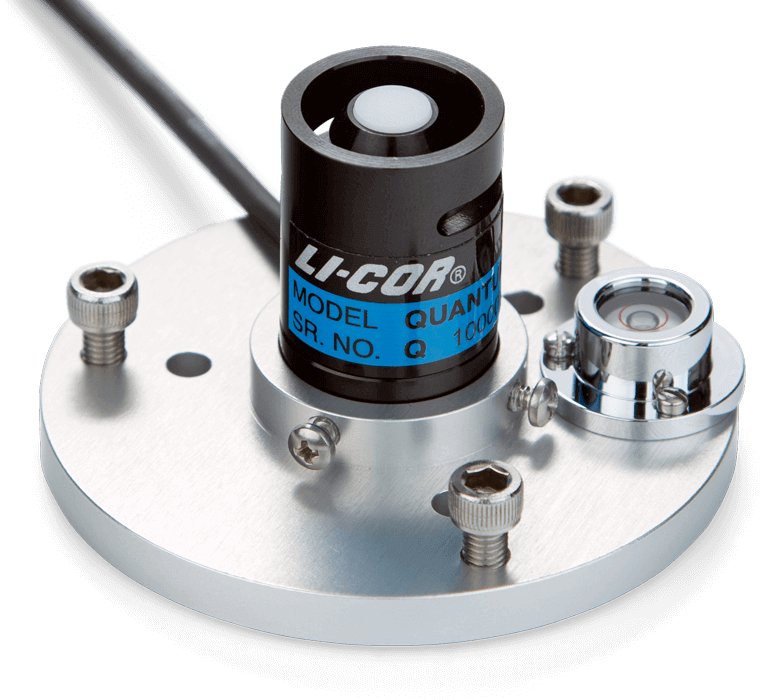
LI-190R terrestrial quantum sensor
LI-COR LI-190R
A silicon photodiode and optical-filter instrument designed to respond to photons across the 400–700 nm PAR band.
Plan the readout hardware and check spectral and cosine response for your lighting.
View product details ↗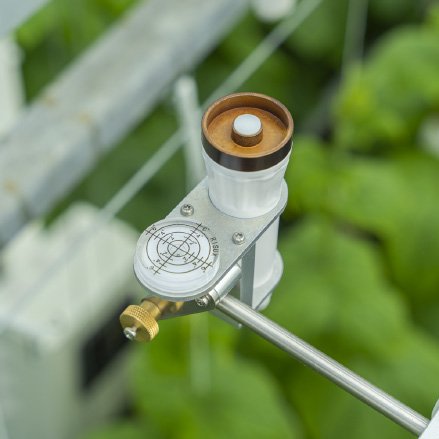
Aranet PRO-series wireless PAR instrument
Aranet PAR Sensor
A wireless PAR sensor that supports canopy-level light observations and comparison of conditions around a greenhouse.
A base station and agreed controller integration are part of the complete package.
View product details ↗| Model | Measurement / role | Data connection | Coverage / installation |
|---|---|---|---|
| Vaisala GMP252 | CO2; nominal range 0–10,000 ppm | Analog voltage/current and RS-485 configured outputs | One sampling location; heated sensor head reduces condensation |
| Aranet CO2 and Temperature Sensor | CO2 concentration, air temperature and atmospheric pressure | Aranet Sub-GHz radio; PRO/PRO Plus base station required | Distributed wireless sampling locations |
| Apogee SQ-500-SS | Photosynthetic photon flux density | Self-powered 0–40 mV output; compatible logger required | One levelled light-measurement point above the canopy |
| LI-COR LI-190R | Photosynthetic photon flux density across conventional PAR | Sensor current output; suitable meter/logger or adapter required | Levelled point measurement above, within or below a canopy |
| Aranet PAR Sensor | Photosynthetic photon flux density | Aranet radio to compatible base station; integration required | Several unshaded points at crop height |
How the measurements work
Non-dispersive infrared gas sensing measures how carbon dioxide absorbs infrared radiation. The instrument compares optical signals and applies its calibration and compensation to report concentration. Temperature, pressure, contamination and condensation can affect the measurement path. Heated sensing heads and protective arrangements help manage exposure, but the installed operating limits still matter.
Quantum sensors use an optical diffuser, filters and a detector to approximate a photon-weighted response across the selected waveband. Spectral response describes how sensitivity varies with wavelength. Cosine response describes how the reading changes as light arrives at an angle. Both are relevant where sunlight, LEDs and reflected light reach the sensor from different directions.
Conventional PAR and extended PAR are different band definitions. Do not combine a conventional 400–700 nm record with an ePAR record without retaining the instrument and waveband information. A controller target based on one definition should receive matching measurements.
Turn a light record into daily light integral
Daily light integral, or DLI, sums photon flux over a day and is expressed in moles per square metre per day. For a constant PPFD of 200 µmol m−2 s−1 over 12 hours, DLI is 200 × 43,200 ÷ 1,000,000 = 8.64 mol m−2 day−1. That example assumes the level stays constant throughout the period.
A greenhouse rarely has constant light. Record at a suitable interval and integrate the actual readings, retaining missing-data flags. A single midday measurement cannot represent a day containing cloud, screen movement and changing lamp schedules. Purdue's greenhouse DLI guide explains why daily accumulation gives information that a spot light reading cannot.
Install for the quantity you want to understand
Level a canopy light sensor and keep its diffuser clear of leaves, irrigation residue and structural shade that does not represent the crop area. Several positions can reveal variation under lamps or across benches. Decide whether you are measuring above-canopy delivery, transmission through the canopy or outdoor radiation; those positions answer different questions.
Place CO2 sampling points where they represent the intended growing zone, away from a concentrated injection jet. Check gradients under ordinary ventilation and enrichment operation. Avoid breathing near a sensor during a spot comparison. Keep the sampling location and distance from distribution equipment in the installation record.
Automatic baseline calibration deserves particular attention in an enriched greenhouse. A routine expecting periodic exposure to ordinary outdoor air may be inappropriate when concentrations stay elevated. Select a manufacturer-supported calibration mode and procedure for the actual environment, rather than assume every automatic routine suits continuous enrichment.
Why photon measurements became standard
Work on the photosynthetic response to different wavelengths helped establish photon-based PAR measurements. LI-COR's explanation cites McCree's 1972 crop studies, which compared spectral response and definitions of photosynthetically active radiation. Modern lamp mixtures make spectral matching relevant to instrument selection as well as plant lighting design.
- NDIR
- Non-dispersive infrared gas measurement.
- PPFD
- Photosynthetic photon flux density at a measurement surface.
- DLI
- Daily accumulated photon quantity per unit area.
- Cosine response
- An instrument's response to light arriving at different angles.
Questions about CO2 and PAR
Does a CO2 probe's temperature channel replace a canopy climate sensor?
Only when its specified output, accuracy and placement match that task. Temperature used internally for gas compensation should not be assumed to describe canopy air.
Can I calculate DLI from the lighting schedule?
A schedule gives duration. You still need the delivered PPFD, including daylight, dimming and shading, to calculate the photon total.
Does a wireless PAR sensor connect directly to every climate computer?
No. Confirm the base station, interface, units and supported integration before assigning the record to control.