See a whole field, then decide where to walk
Satellite imagery shows spatial patterns that a single soil probe or a drive along the headland can miss. Repeated observations reveal uneven establishment, canopy development, harvest timing and changes in standing water. The strongest use on a farm is often prioritising scouting: identify an unusual patch, visit it, record the cause and follow its development. A colour on a map alone does not identify a disease, nutrient shortage or irrigation fault.
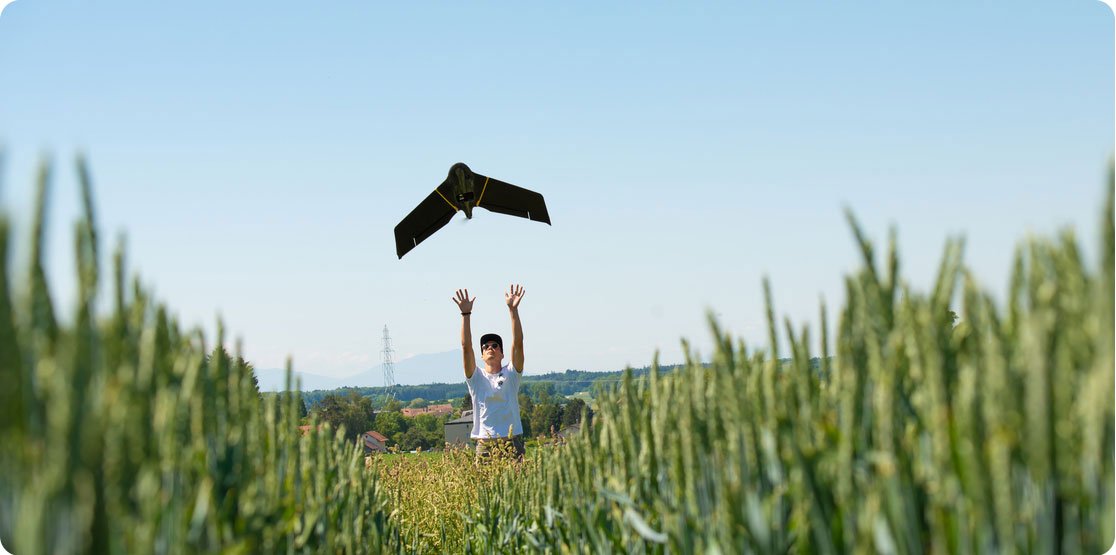
Begin with a question and a field boundary. For checking a large block every week, a moderate-resolution time series may suffice. Counting individual plants or inspecting a narrow drainage ditch calls for much finer detail, often from a drone or a ground inspection. Imagery should complement the root-zone measurements and weather observations that explain why a crop changed.
What optical satellites measure
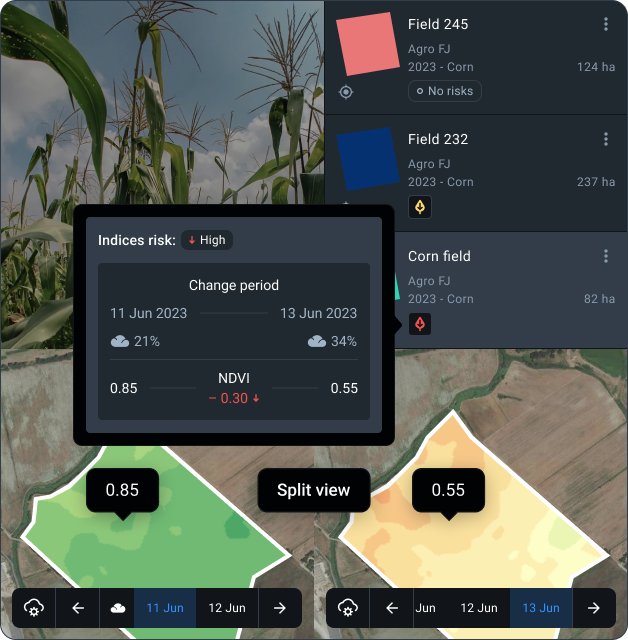
A multispectral instrument measures reflected sunlight in separate wavelength bands. Visible red and near-infrared observations can be combined into the normalised difference vegetation index, NDVI = (NIR − red) / (NIR + red). Healthy green foliage often absorbs red light and reflects more near-infrared light, but the result also changes with exposed soil, leaf area, crop type and growth stage. Dense canopies can produce a compressed NDVI response, making small differences difficult to interpret.
A pixel contains the combined response of an area on the ground. At 10 m sampling, one square pixel represents 100 m²; a 20 m pixel represents 400 m². A narrow field edge may mix crop, road, hedge and neighbouring land in the same observation. Resampling a coarse band to a smaller grid does not add detail that the instrument never observed. Compare band resolution and usable interior pixels before choosing an index.
Surface reflectance products attempt to account for atmospheric effects so that observations can be compared. Cloud masks flag pixels that should not be treated as clear measurements. Shadows, haze and thin cloud can remain difficult cases. Examine the actual acquisition date and scene quality rather than relying only on a dashboard's latest-update label.
Public missions and commercial imagery
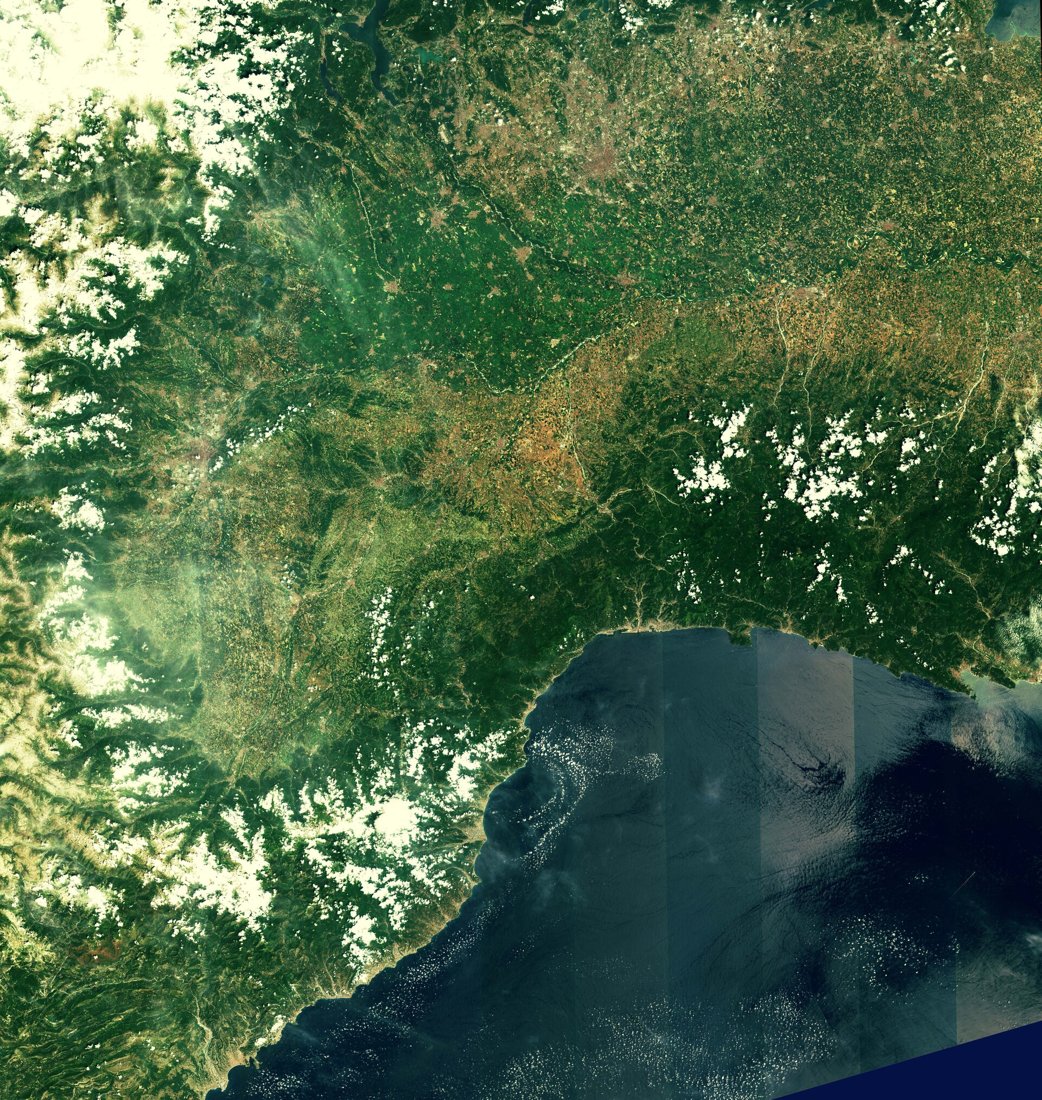
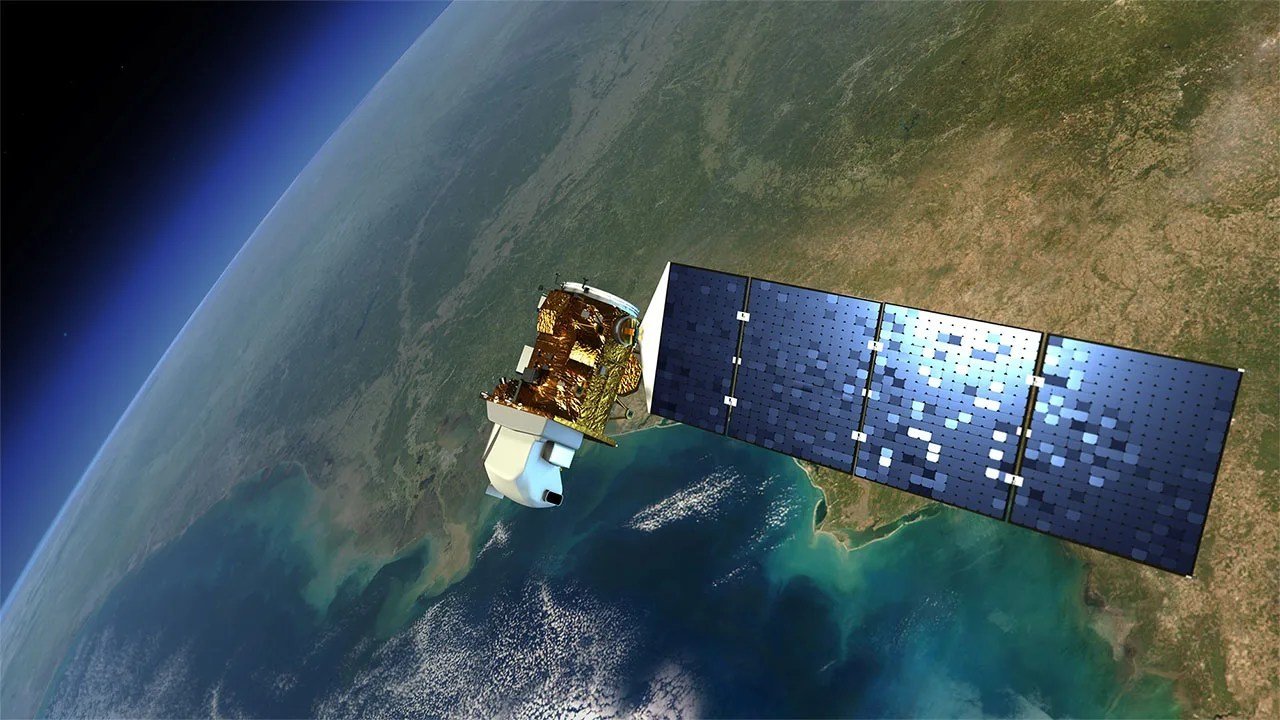
Landsat began its long Earth-observation record in 1972. That archive supports analyses of land use and multi-year change. Sentinel-2A launched in June 2015 and introduced a widely used multispectral source for crop monitoring. The image above records an early Sentinel-2A observation of the Po Valley and surrounding terrain. Public missions make repeated landscape observations available, while commercial suppliers can offer finer sampling, additional acquisition opportunities or contracted delivery arrangements.
Choose a data source by field size, observation frequency and the decision deadline. Nominal revisit describes acquisition opportunities; clouds determine how many optical images are actually useful. A purchase should specify the image product, permitted uses, area covered and delivery conditions. Compare farmer-facing platforms and imagery suppliers in the satellite service comparison.
Build a field time series
- Check boundaries against a recent image and exclude roads, buildings and neighbouring fields.
- Keep the satellite, processing level, band combination and cloud criteria consistent where possible.
- Inspect every scene before calculating a field mean. A partly cloudy field is not equivalent to a fully observed field.
- Compare the same crop and growth phase. A harvested strip should not be interpreted as a failing growing canopy.
- Visit persistent anomalies and record crop stage, pests, irrigation, compaction and drainage alongside the map.
Field means can conceal important patches. Retain spatial maps as well as summary curves, and mark missing observations as missing. Interpolating a smooth line through a cloudy interval can be useful for presentation, but it does not create a measured observation on those dates.
Terms that affect the decision
- Multispectral
- Measurements in several discrete wavelength bands.
- Spatial resolution
- The level of ground detail represented by a measurement and its processing.
- Revisit
- The interval between potential observations of a location.
- Cloud mask
- A quality layer identifying cloud and related contamination.
- Ground validation
- Field observations used to check the meaning of a remotely observed pattern.
Questions growers ask
Can a satellite tell me when to irrigate?
It can reveal canopy patterns and contribute to water-use models. Irrigation timing also needs root-zone water, weather, crop stage and system constraints. A vegetation index is not a direct measurement of plant-available soil water.
Why do two services show different colours?
They may use different dates, indices, cloud masks, scaling or colour legends. Read the underlying values and acquisition metadata before comparing the displays.
What if the field stays cloudy?
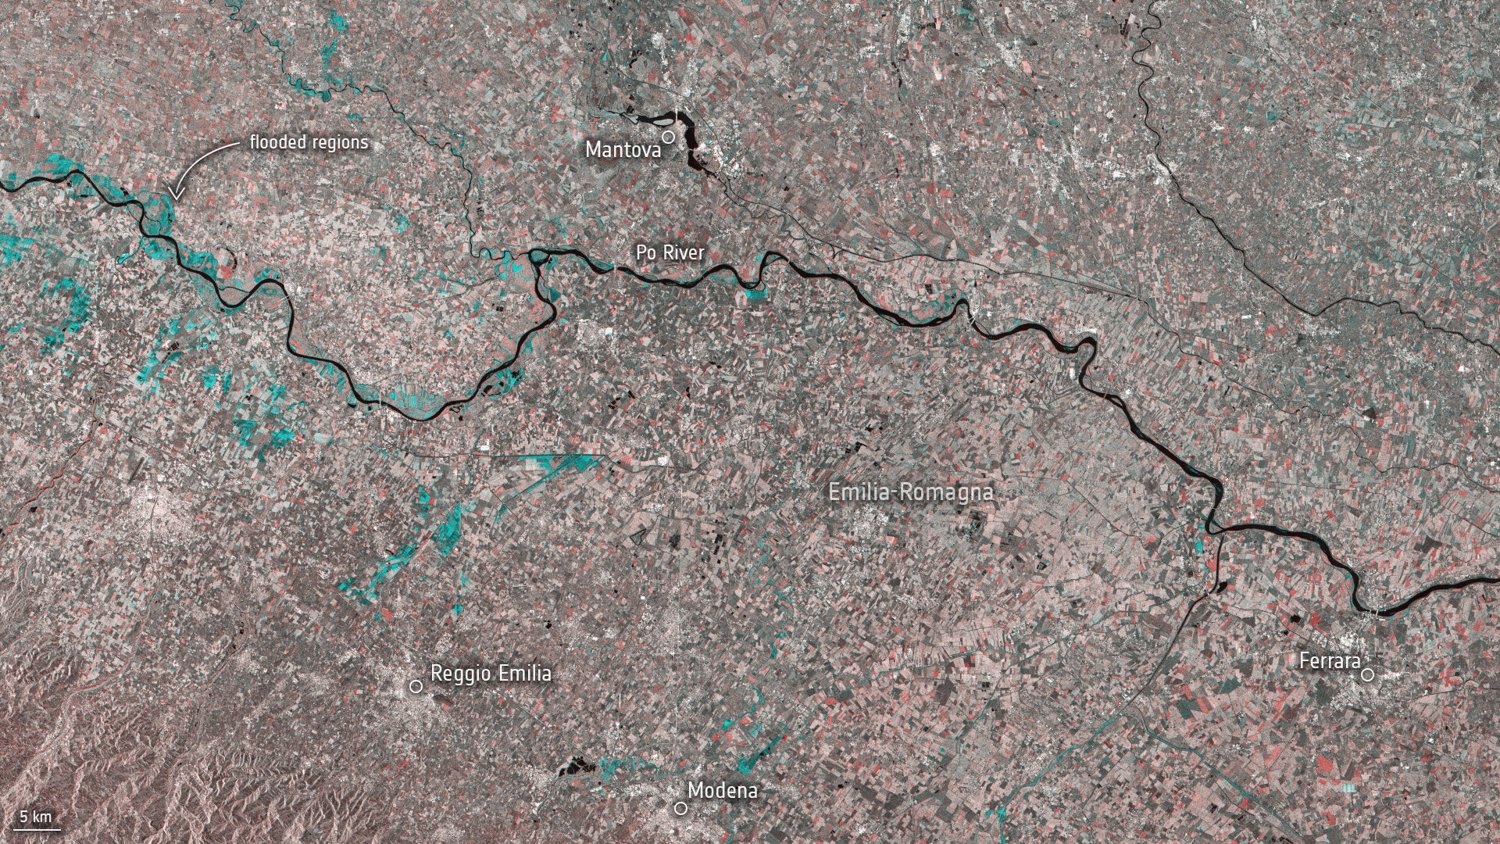
Consider radar observations, local sensors and a scheduled inspection. Radar provides another kind of measurement and needs its own interpretation.